Why Your Monitoring Dashboard Is Lying to You
Your dashboards are green. Everything looks fine. Then production breaks and you have no idea why. Here's what your monitoring isn't telling you.
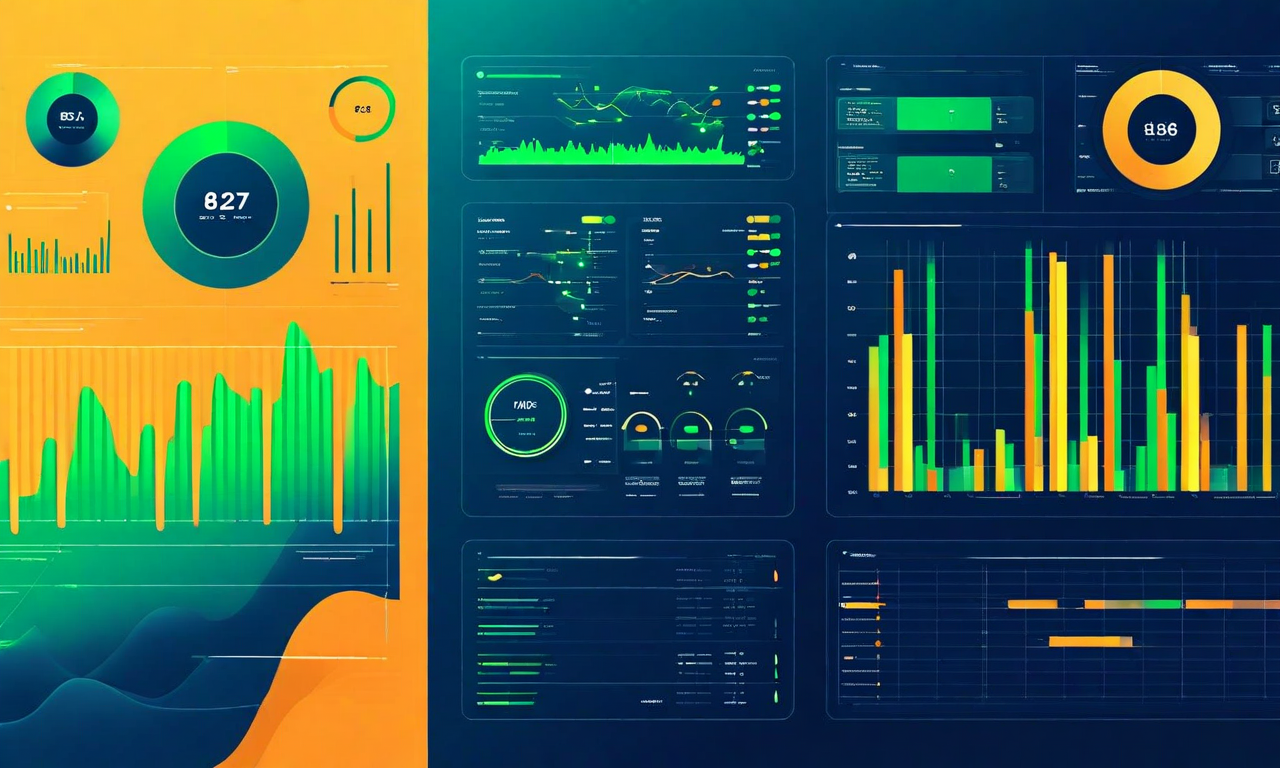
All dashboards green. CPU normal. Memory stable. Response times acceptable.
Then your biggest customer calls: “The app has been broken for 2 hours.”
How is this possible? Monitoring says everything is fine. Reality says everything is broken. The disconnect isn’t unusual—it’s the norm for most engineering teams.
The Core Problem
Your monitoring is measuring what's easy to measure, not what matters. Dashboards can be green while customers suffer. Having dashboards isn't the same as having observability.
The pattern is depressingly common: set up monitoring (check), create dashboards (check), add some alerts (check), assume you have observability (wrong).
The Three Lies Your Dashboard Tells
Lie #1: “Response Time Is Normal”
What the dashboard shows:
- Average response time: 200ms
- P95: 450ms
- Looks healthy
What’s actually happening:
- 2% of requests timing out completely
- Timeouts aren’t included in the average
- Worst experiences are invisible
- Customers in that 2% are churning
The Fix
Track error rates alongside latency. Track P99 and P99.9. Track timeouts explicitly. The average hides more than it reveals.
Lie #2: “CPU/Memory Are Fine”
What the dashboard shows:
- CPU: 45%
- Memory: 60%
- Plenty of headroom
What’s actually happening:
- One container is at 95% CPU
- The average hides the outlier
- That container serves your biggest customer
- Aggregate metrics mask individual failures
The Fix
Show distribution, not just averages. Alert on percentiles. Monitor per-customer where possible. One hot container hidden in a fleet average is a ticking bomb.
Lie #3: “No Alerts Fired”
What the dashboard shows:
- Alert history: empty
- System must be healthy
What’s actually happening:
- Alerts aren’t configured for this failure mode
- Thresholds are too generous
- Alert fatigue led to disabled alerts
- Absence of alerts does not equal absence of problems
The Fix
Treat "no alerts" with suspicion. Regularly test alert coverage. Ensure alerts match your SLOs. If you haven't triggered an alert in months, your alerts might be broken—not your system.
The Pattern Across All Three
Monitoring optimizes for what's measurable. What matters might not be measured. Each lie isn't about bad tooling—it's about measuring the wrong things.
What Monitoring Misses
Even when your metrics are accurate, they’re probably tracking the wrong layer.
Missing: Business Metrics
What Most Teams Track
- Request latency
- Error rate
- Database connections
- CPU utilization
What Actually Matters
- Checkout completion rate
- Revenue per minute
- User signups
- Feature adoption
Technical metrics can be green while business metrics are red. Your API responds in 200ms, but checkout conversions dropped 40% because a JavaScript error on the payment page isn’t server-side.
Missing: User Experience
What’s measured: server response time, API latency, backend performance. What’s not measured: time to interactive, client-side errors, actual user journey completion, perceived performance.
Missing: Dependencies
What’s measured: your services, your databases, your infrastructure. What’s not measured: third-party API latency, CDN performance, DNS resolution, payment processor status.
Missing: The Connections
What’s measured: individual services, individual metrics. What’s not measured: request flow across services, correlation between events, causation chains—why something failed, not just that it failed.
The Gap
Most monitoring tells you THAT something is wrong. Good observability tells you WHY. That distinction is the difference between a 15-minute resolution and a 4-hour war room.
The Observability Shift
The problem isn’t your monitoring tool. It’s confusing monitoring with observability.
| Monitoring | Observability |
|---|---|
| Pre-defined metrics | Exploratory analysis |
| Known failure modes | Unknown unknowns |
| Dashboards | Trace exploration |
| ”Is it broken?" | "Why is it broken?” |
| Reactive | Investigative |
The Three Pillars
Metrics
What's happening (quantitative). Counters, gauges, histograms. Good for alerting and trending.
Logs
What happened (qualitative). Detailed events, structured and searchable. Good for investigation and audit.
Traces
How it happened (contextual). Request flow across services. Good for debugging and optimization.
Metrics tell you something is wrong. Logs tell you what happened. Traces tell you why. You need all three working together.
The shift required isn’t tooling—it’s mindset:
- From: “Do we have monitoring?” To: “Can we answer any question about system behavior?”
- From: “Are dashboards green?” To: “Can we explain customer-reported issues?”
- From: “Did alerts fire?” To: “Do we detect problems before customers do?”
The Questions to Ask About Your Monitoring
The Diagnostic
-
1
"When was the last time customers found a bug before monitoring did?"
If recent, monitoring is insufficient.
-
2
"Can you trace a single request across all services?"
If not, you'll struggle with distributed debugging.
-
3
"What business metrics are dashboarded?"
If none, technical health doesn't equal business health.
-
4
"What's the alert-to-incident ratio?"
Low ratio means alert fatigue or missing alerts.
-
5
"Can a new engineer diagnose a production issue?"
If not, observability requires tribal knowledge.
Your Gaps at a Glance
| Question | Good Answer | Bad Answer |
|---|---|---|
| Time from incident to diagnosis | Minutes | Hours |
| % of incidents detected before customers | >90% | <50% |
| Dashboards with business metrics | Multiple | None |
| Trace coverage | All services | Some services |
| Log retention and searchability | Weeks, instant | Days, slow |
If you can’t answer why something failed within 15 minutes, you have an observability gap.
What Good Looks Like
The Observability Maturity Model
| Level | Characteristics |
|---|---|
| Level 1: Basic | CPU, memory, disk. Alerts on thresholds. |
| Level 2: Service | Per-service metrics. Error rates. Response times. |
| Level 3: Distributed | Traces across services. Correlation. |
| Level 4: Business | Business metrics alongside technical. SLOs defined. |
| Level 5: Predictive | Anomaly detection. Capacity planning. Proactive. |
Most teams are at Level 1-2. The gap between Level 2 and Level 4 is where most production pain lives.
The target state:
- Detect issues before customers
- Diagnose issues in minutes, not hours
- Understand business impact of technical issues
- Answer questions you didn’t anticipate
- Onboard new engineers without tribal knowledge
Moving up each level requires intentional investment, not just tooling. You can’t buy your way to Level 5 with a Datadog subscription.
The Bottom Line
What Is Your Monitoring Not Telling You?
If your dashboards are green but customers still find bugs first, incidents take hours to diagnose, business impact is unknown during outages, and new engineers can't investigate alone—your monitoring is lying by omission.
Observability isn't a tool you buy. It's a capability you build.
Found this helpful? Share it with an SRE who's suspicious of green dashboards.
Ready to move beyond dashboard theater?
- Take the 2AM test — Is your infrastructure really production-ready?
- What ‘Done’ actually means — Monitoring is part of the delivery checklist
- Schedule a consultation — Discuss your observability gaps with engineers who’ve closed them
- Explore our DevOps services — How we build observability into every project
Related Articles
The 2AM Test: Is Your Infrastructure Production-Ready?
The real test of infrastructure isn't performance benchmarks. It's what happens when something breaks at 2AM. Here's the checklist that separates ready from risky.
Why Your CI/CD Pipeline Is Slower Than It Should Be
Slow pipelines aren't inevitable. Most slowness comes from fixable patterns that accumulate over time. Here's what's slowing you down and how to fix it.
Why DevOps Isn't a Role: The Organizational Pattern That Defeats Itself
Hiring a 'DevOps team' often creates the silos DevOps was meant to eliminate. Here's what DevOps actually means—and how to build the capability without the dysfunction.
Need Help With Your Project?
Our team has deep expertise in delivering production-ready solutions. Whether you need consulting, hands-on development, or architecture review, we're here to help.